Run an account audit
Open Account audit under Reports in Ads Manager. It reads your synced ad results and shows where money goes, what costs too much, and what to fix first. At the end, you have a short list of fixes and a report you can download, email or share. It takes about 10 minutes to read the first time.
Before you start
- Your Facebook account, Page and ad account are connected in Setup. See Set up Ads Manager.
- Your ads have spent money in the period you pick. The audit reads synced results, not live Meta screens.
- You can see Ads Manager in the WhatsApp panel. If not, ask your admin.
What the audit shows
The audit has 5 tabs. Every tab compares the period you pick with the same number of days before it.
| Tab | What it answers |
|---|---|
| Overview | What did the audit find? How does spend split across funnel stages? |
| Auction | What does it cost to reach people? How are your ad sets set up? How does Meta rank your ads? |
| Targeting | Which audiences bring the best results? |
| Geo & demo | Which countries, regions, ages and languages bring results? |
| Creative & copy | Shortcuts to the image, video and ad text reports. |
Steps
Open the audit and set the period
- Open WhatsApp in the left rail, then select Ads Manager.
-
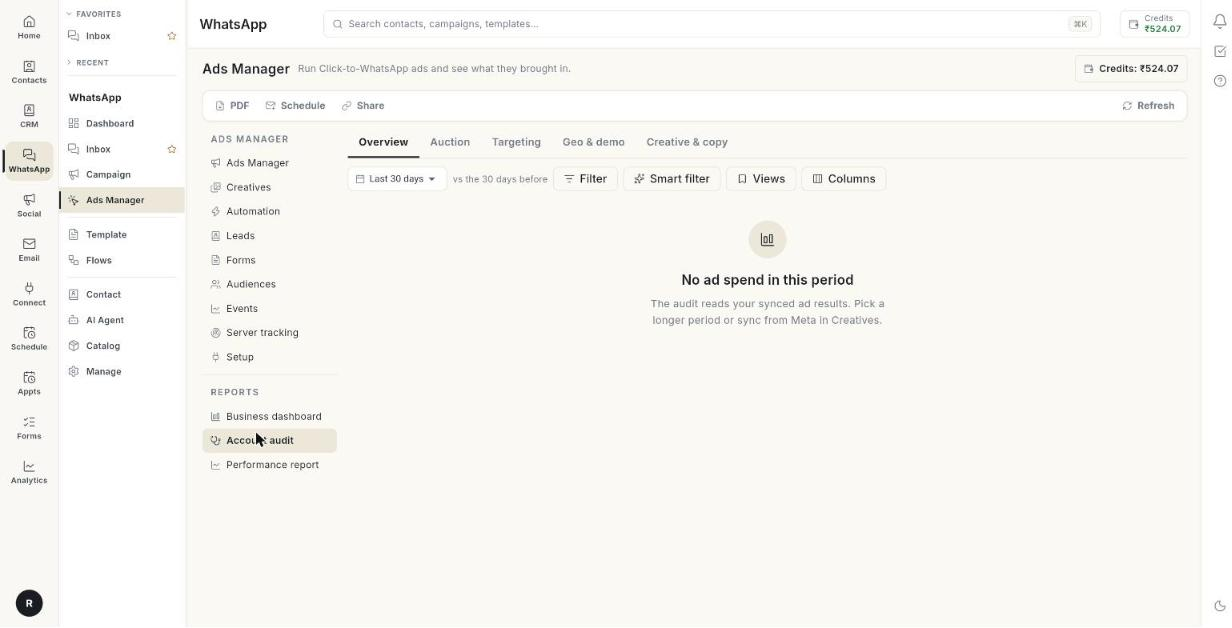
Under Reports in the left column, select Account audit.
-
Pick a period: Last 7 days, Last 14 days, Last 30 days or Last 90 days. The line vs the N days before shows what each number is compared with.
- Optional: narrow the audit with Filter, Smart filter or Views. See Filter the audit.
- Click Refresh to rebuild the audit.
If the page says No ad spend in this period, pick a longer period or click Sync from Meta in Creatives.
Read the Overview tab
- Select the Overview tab.
- Read What the audit found first. Findings are listed most important first. Each has a label.
- If the card says Nothing needs attention in this period., no finding was raised.
- Read the tiles under it. Each tile shows the change against the period before. Green means better. Red means worse.
- Read By funnel stage. Each ad set is placed in a stage by the audiences it targets: Prospecting, Re-engagement, Retargeting or Retention.
- Click Columns to choose the numbers in the table: Share of spend, Spend, the result name, Cost / result, Revenue, ROAS, CPM, CPC, CTR, Frequency, Impressions and Link clicks.
- Click Reset to go back to the default columns.
- Read Stage by stage. Pick 2 numbers. One is drawn as bars and one as a line, for each stage, per day.
- Read Stage drilldown. Pick a chip such as Spend or CPM to compare all stages on one number.
- Read Spend by stage. It shows spend per day, stacked by stage.
| Label | Meaning |
|---|---|
| Fix first | A high-severity problem. Act on it before anything else. |
| Worth a look | A medium-severity problem. |
| Opportunity | Something that can bring better results. |
| Tip | A smaller suggestion. |
| Tile | What it shows |
|---|---|
| Spend | Money spent in the period. |
| Result tile | The result your ads are measured on: Conversations, Leads, Purchases or Link clicks. |
| Cost per result | Spend divided by results. Lower is better. |
| ROAS | Revenue divided by spend. |
| CPM | Cost for 1,000 impressions. Lower is better. |
| Link CTR | Link clicks divided by impressions. |
| Frequency / day | How often a person saw an ad that day. Lower is better. |
Tip
Check that most of your spend goes to the stage you meant to fund. For example, a large Retargeting share with a small Prospecting share means few new people see your ads.
Read the Auction tab
- Select the Auction tab.
- Read Cost to reach people. It shows CPM and cost per link click, per day.
- Read Attention. It shows link CTR (%) and frequency, per day.
- Pick Dashboard view or Table view. The dashboard shows bars. The table shows GROUP, a count, SPEND, SHARE, the result name, COST / RESULT and ROAS.
- Read each breakdown card. Each one groups your spend and results.
- Read How Meta ranks your ads. Bars show the share of your spend that is Above average, Average, Below average or No ranking.
- Read the table under the bars. It lists each ad with QUALITY, ENGAGEMENT and CONVERSION.
| Card | What it tells you |
|---|---|
| Learning phase | Ad sets still learning, out of learning, or limited by too few results. |
| Budget type | Campaign budget (CBO) against ad set budgets (ABO). |
| Budget breakdown | Spend by budget size. Low, medium and high are the lower, middle and upper third of your own daily budgets. |
| Automatic vs manual bid | Meta bidding for the most results, or a cost, bid or ROAS goal you set. |
| Bid strategy | Every strategy in use. |
| Campaign objective | What each campaign asked Meta for. |
| Ad delivery optimisation | The result each ad set optimises for. |
| Ad type | Normal ads, dynamic creative (DCO), multiple texts (MTO) and catalogue ads (DPA). |
| Quality ranking, Engagement rate ranking, Conversion rate ranking | Meta's ranking against ads competing for the same people. |
| Placement type and Placement | Where the ads ran. |
| Desktop vs mobile, Operating system, Device | What people saw the ads on. |
| Hour of day | Results per hour in the ad account time zone, with cost per result. |
| Day of week | Which weekdays bring results cheapest. |
| Frequency | How many times a day a person saw the ad, and what that bought. |
Ranking needs data
Ads under 500 impressions get no ranking. Rankings show as Above average, Average, Bottom 35%, Bottom 20% or Bottom 10%. A missing ranking shows Not enough data.
Read the Targeting tab
- Select the Targeting tab. It opens Top audiences with 3 views: Audiences, Funnel and Breakdowns.
- Pick Last 7 days, Last 14 days, Last 30 days or Last 90 days.
- In Audiences, read the table: AUDIENCE, AD SETS, spend, RESULTS, COST / [result], VS AVERAGE and EXCLUDED IN.
- Read Account average. It shows the cost per result for the whole account.
- Click Use in ad on a row to open Create Ad with that audience chosen.
- In Funnel, read each stage with LIVE / CREATED, results, cost and VS AVERAGE.
- In Breakdowns, read Buyers by frequency and value, Lookalike %, Lookalike × seed recency and Audience recency.
If you see No audience results yet, ad sets using your audiences have not spent in this period. See Build ad audiences.
Read the Geo & demo tab
- Select the Geo & demo tab.
- Under Grade countries by, pick Cost per result, ROAS or CTR.
- Read Countries. It sorts countries into good, average, costly and result-free.
- Read Country tiers. Tier 1 is the priciest markets. Tier 4 is the cheapest.
- Read Wasted spend by country. It counts countries 1.5 times worse than the account, or with no results. It shows Share of spend wasted and Potential uplift.
- Read Trending countries. It shows the biggest change against the period before.
- Click a country on the map to see its regions. Click Show all to return.
- Read International scaling. Pick Tiers or Regions to see day-by-day changes.
- Read Age & gender. Pick Age × gender, Age or Gender.
- Read Language. It covers Targeting language, Copy language and Spoken country language.
If the tab shows No breakdowns for this period, country, region and age results appear once ads have run.
Read the Creative & copy tab
- Select the Creative & copy tab.
- Click Open creative insights to see which images and videos win, by format, with fatigue flags.
- Click Open ad copy insights to see how text length, emojis, links and phrases perform.
See Use ad creatives for these reports.
Act on the findings
- Start with each Fix first finding. Read its detail line.
- Open the page that matches the finding.
- Change 1 thing at a time.
- Run the audit again after a few days to see the change.
| If the finding is about | Go to |
|---|---|
| Ads that spend with no results, or tired ads | Automate your ads. Create a Stop Loss rule. |
| Weak or tired images and text | Use ad creatives |
| Audiences that cost too much | Targeting tab, then Use in ad |
| Countries that waste spend | Create an ad. Remove those locations. |
Filter the audit
- Click Filter. The button reads Filter · N when filters are on.
- Fill the Filter data window. See the fields in Use ad creatives.
- Or click Smart filter and pick a ready-made filter, for example Spending with no results.
- Click Views, then Save the current filter and columns… to keep your setup.
- Click Clear filters to remove all filters.
Download the audit as a PDF
- Click PDF in the top bar to download the audit. On a page without the top bar, the button reads Download PDF.
- Open the file. It is named like
ad-account-audit-30d.pdf.
Email the audit on a schedule
- Click Schedule. The New scheduled email window opens.
- Type a Name (optional), for example "Monday numbers for the owner".
- Under How often, pick Daily, Weekly or Monthly. Pick at least 1.
- For Monthly, set Day of month.
- Set At for the hour and Minute for the minute the email goes out.
- In Send to, type up to 10 email addresses, separated by commas. Click Add team members to pick from your team.
- Optional: type addresses in CC (optional) to copy them.
- Optional: click Edit PDF view to choose the sections, measures and logo in the PDF.
- Keep Active on. Switch it off to pause the schedule.
- Click Send a test email to check it.
- Click Save.
Share the audit with a link
- Click Share. The Share the Account audit window opens.
- Pick the expiry from the list beside Create & copy link: Expires in 7 days, Expires in 30 days, Expires in 90 days or Never expires.
- Click Create & copy link.
- Send the link. Anyone with it sees a live page with a PDF download, with no login.
- To stop sharing, revoke the link in the same window.
A shared link is public
Anyone who has the link can read your spend and results until you revoke it or it expires.
Troubleshooting
| Issue | Cause | Fix |
|---|---|---|
| Could not build the audit | The audit could not read your synced data. | Click Retry. If it repeats, check Setup. |
| No ad spend in this period | Your ads did not spend in the period, or results have not synced. | Pick a longer period. Click Sync from Meta in Creatives. |
| No data in this period. on a card | No ad set or ad fell in that group. | Pick a longer period. |
| No breakdowns for this period | Ads have not run long enough for country, region and age results. | Wait until ads have run, then click Refresh. |
| Not enough data in a ranking | The ad has under 500 impressions. | Let the ad run longer. |
| Could not build the PDF. | The PDF export failed. | Click PDF again. If it repeats, shorten the period. |